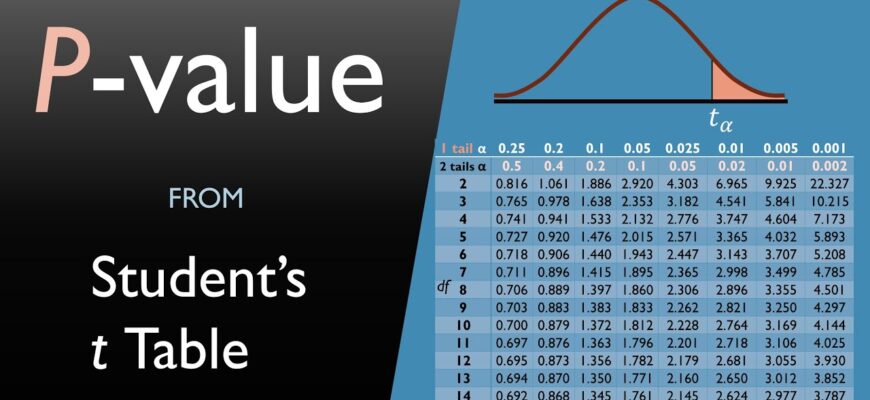
Calculate the test statistic, then find the probability of getting a result at least that extreme under the null hypothesis using a table or software such as Excel.
Meaning
The p-value is the probability of seeing results as extreme as yours (or more) if the null hypothesis were true. A small p-value suggests the data are unlikely under the null.
Steps
- State null and alternative hypotheses.
- Compute the test statistic (z or t).
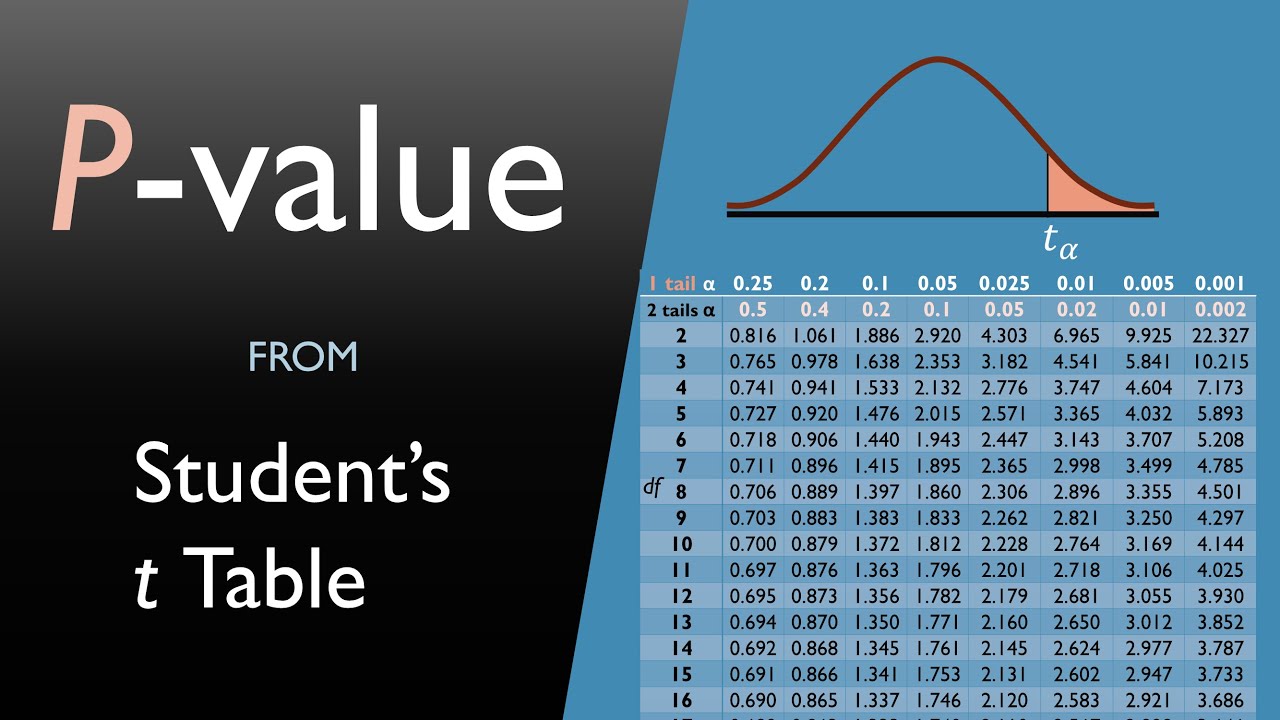
- Find the tail area from a z table, t table or software.
- For a two-tailed test, double the tail.
Example
A z-statistic of 1.96 gives a two-tailed p of about 0.05.
Interpreting
Typically, p below 0.05 is called statistically significant. This threshold is a convention.
Warning
A p-value is not the probability the hypothesis is true.
Tools
Excel (T.TEST), R or Python (scipy).
Based on data from the American Statistical Association and standard statistics textbooks.