- Understanding the Meaning of Infographic: A Comprehensive Guide
- What is an Infographic?
- Types of Infographics and Their Uses
- Benefits of Using Infographics in Communication
- How to Create an Effective Infographic
- Common Mistakes to Avoid in Infographic Design
- Infographic Tools and Software
- Comparing Infographics to Other Visual Content Forms
- Frequently Asked Questions about Infographics
Understanding the Meaning of Infographic: A Comprehensive Guide
In the digital age, the term “infographic” has become ubiquitous across various platforms, from educational content to marketing strategies. But what exactly is an infographic, and why has it gained such prominence? This article delves deep into the meaning of infographics, their purpose, types, benefits, and how to create effective visual content that attracts and retains audience interest.
What is an Infographic?
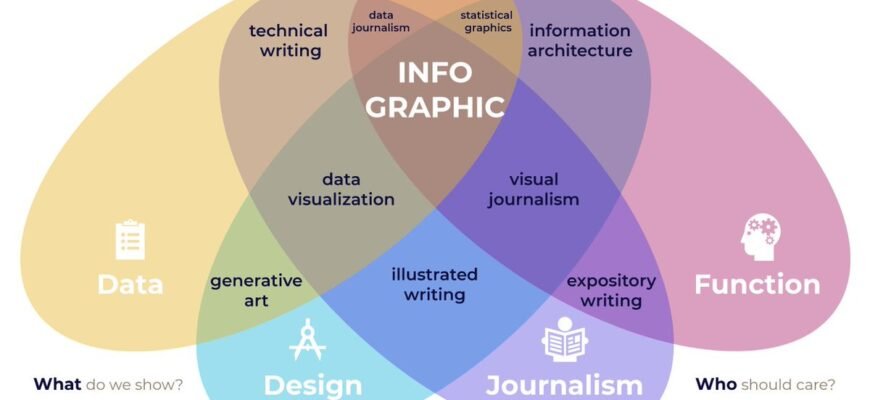
An infographic is a visual representation of information, data, or knowledge intended to present information quickly and clearly. By combining text, icons, graphs, and images, infographics simplify complex information, enabling quicker comprehension. They run the gamut from simple data visualizations to elaborate design pieces used to convey statistics, processes, or trends.
Types of Infographics and Their Uses
Infographics come in various formats, each serving a different purpose:
- Statistical Infographics: Used to highlight key data points and statistics for reporting and analysis.
- Process Infographics: Perfect for outlining step-by-step processes or workflows.
- Timeline Infographics: Ideal for displaying a series of events or the evolution of a concept over time.
- Comparison Infographics: Employed to showcase differences or similarities between two or more subjects.
- Hierarchical Infographics: Used to organize information from largest to smallest, or most to least important.
- Informational Infographics: Provide an overview or educational content on a particular topic.
Benefits of Using Infographics in Communication
Infographics have become indispensable due to their numerous benefits:
- Enhances Understanding: By visualizing data, infographics make complex information more digestible.
- Increases Engagement: Visual content is more engaging than text alone, retaining viewer attention longer.
- Boosts Information Retention: People remember visual information better than plain text.
- Facilitates Shareability: Infographics are highly shareable across social media platforms, expanding their reach.
- Improves SEO: Infographics can drive traffic and backlinks, enhancing site visibility in search engines.
How to Create an Effective Infographic
Creating an impactful infographic involves several steps:
- Define Your Goals: Understand the objective of your infographic and what you want to achieve.
- Know Your Audience: Tailor the content to the needs and interests of your target audience.
- Research and Collect Data: Use reliable sources to gather accurate and relevant data.
- Create a Wireframe: Plan the layout and structure of your infographic.
- Design the Infographic: Use design tools like Adobe Illustrator or Canva to create your visual content.
- Review and Revise: Double-check all information and design elements for accuracy and clarity.
- Publish and Promote: Share your infographic on websites, social media, and other platforms to maximize reach.
Common Mistakes to Avoid in Infographic Design
While infographics are powerful tools, common mistakes can diminish their effectiveness:
- Overloading with Information: Keep it concise and focus on key data points to maintain clarity.
- Poor Design Balance: Ensure a balance between text and visuals to avoid clutter and confusion.
- Neglecting Branding: Infographics should reflect your brand’s identity for cohesiveness.
- Lack of Credibility: Always attribute your data to reliable sources to maintain trustworthiness.
- Ignoring Mobile Optimization: Ensure your infographic is viewable and legible on all devices.
Infographic Tools and Software
Various tools can streamline the creation of stunning infographics:
| Tool/Software | Features | Price Range |
|---|---|---|
| Canva | Templates, drag-and-drop editor, collaboration features | Free – $12.95/month |
| Adobe Illustrator | Advanced design capabilities, vector graphics | $20.99/month |
| Visme | Data visualization tools, branded content | Free – $25/month |
| Piktochart | Ease of use, infographic-specific templates | Free – $12.50/month |
Comparing Infographics to Other Visual Content Forms
Infographics vs. other types of visual content:
- Infographic vs. Presentation: Infographics are static and concise, whereas presentations often require oral or written explanations.
- Infographic vs. Video: Videos are more dynamic and engaging but require more resources to produce. Infographics allow for quick consumption.
- Infographic vs. Image: While images convey a single idea, infographics combine multiple concepts into a cohesive narrative.
Frequently Asked Questions about Infographics
- What software is best for creating infographics? Canva, Adobe Illustrator, Visme, and Piktochart are popular tools for creating infographics.
- How can infographics improve SEO? Infographics can boost SEO by increasing engagement, generating backlinks, and driving traffic to your website.
- Which industries benefit from using infographics? Education, marketing, healthcare, and finance are just a few sectors that benefit from using infographics.
- Is it possible to create an infographic without design experience? Yes, many user-friendly tools like Canva and Piktochart make it easy to create infographics with no design experience.
- What are the key elements of an effective infographic? Clear objectives, accurate data, appealing design, and concise content are crucial elements of an effective infographic.
json